Turtles in California
11 species of turtles have a mapped range in California. The most widespread is the Western Pond Turtle, mapped across 50% of the state.
The most restricted is the Green Sea Turtle, mapped in 1% of the state.
The heaviest is the Leatherback Sea Turtle, at 2,094 lb (950 kg); the lightest is the Western Pond Turtle, at 4.0 lb (1.8 kg).
USGS marks 3 of them as introduced in the state: the Pond Slider, the Snapping Turtle and the Painted Turtle.
The most species are mapped in San Diego County (9); the fewest in Mono County (0).
Open-licence records in the state (6,339 of them) peak in April and are fewest in December.
The most often recorded is the Pond Slider, with 2,705 open-licence records in the state.
By the trait records, 6 are active by day and by night, 4 are active by day and 1 is active at night.
They belong to 6 families; the largest here is Cheloniidae, with 4 species.
- 1 to 2
- 3 to 4
- 5
- 6 to 7
- 8 to 9
| Species | Size | Share of California | Active | Records | |
|---|---|---|---|---|---|
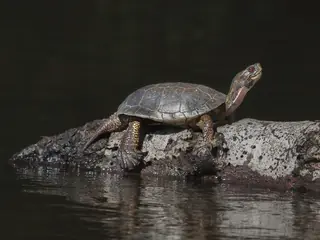 | Western Pond Turtle Actinemys marmorata Emydidae | 8.3 in (210 mm) snout to vent | 50% | day and night | 2,047 |
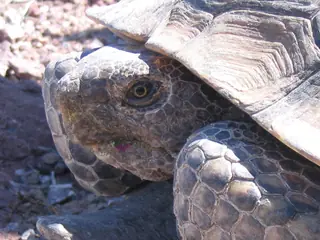 | Desert Tortoise Gopherus agassizii Testudinidae | 14 in (360 mm) snout to vent | 24% | day and night | 1,604 |
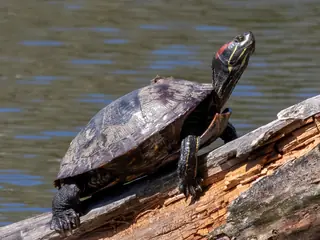 | Pond Slider introduced Trachemys scripta Emydidae | 10 in (264 mm) snout to vent | 19% | day | 2,705 |
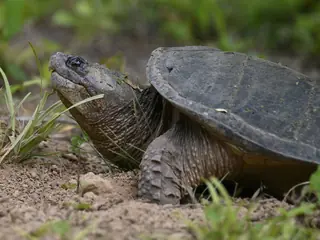 | Snapping Turtle introduced Chelydra serpentina Chelydridae | 20 in (500 mm) snout to vent | 18% | night | 29 |
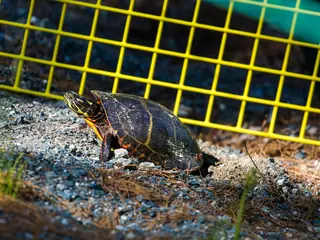 | Painted Turtle introduced Chrysemys picta Emydidae | 9.8 in (250 mm) snout to vent | 9% | day | 20 |
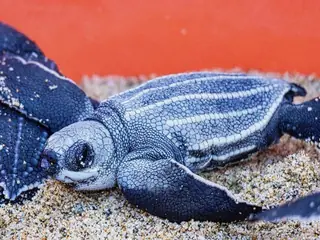 | Leatherback Sea Turtle Dermochelys coriacea Dermochelyidae | 8.9 ft (2,700 mm) snout to vent | 5% | day and night | 37 |
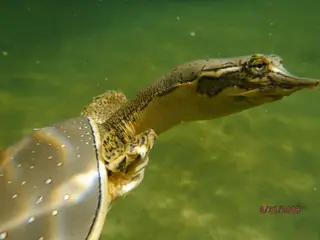 | Spiny Softshell Apalone spinifera Trionychidae | 2.1 in (54 mm) snout to vent | 3% | day | 101 |
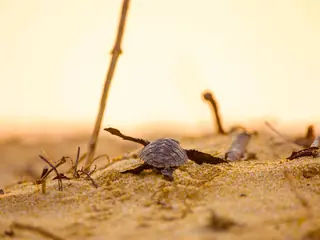 | Olive Ridley Sea Turtle Lepidochelys olivacea Cheloniidae | 2.0 ft (610 mm) snout to vent | 3% | day | 12 |
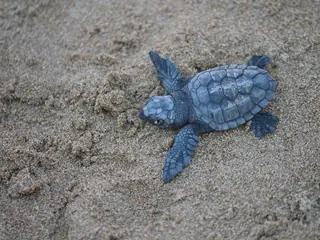 | Loggerhead Sea Turtle Caretta caretta Cheloniidae | 7.0 ft (2,130 mm) snout to vent | 2% | day and night | 13 |
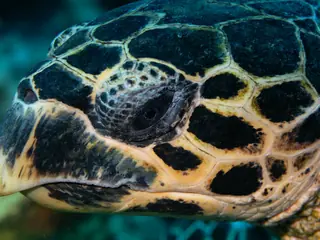 | Hawksbill Sea Turtle Eretmochelys imbricata Cheloniidae | 3.3 ft (1,000 mm) snout to vent | 2% | day and night | |
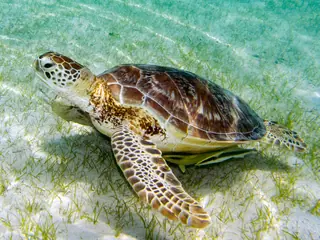 | Green Sea Turtle Chelonia mydas Cheloniidae | 4.9 ft (1,500 mm) snout to vent | 1% | day and night | 51 |
Share of California is the part of the state inside the species' USGS range map. Size is the largest on record where the source gives a maximum, otherwise a typical adult. Records are open-licence observations and specimens in the state; a blank means none were counted, not that the species is absent.
More California lists
Other groups in California
Turtles in nearby states
Sources
- GBIF Backbone Taxonomy. CC BY 4.0. Read 2026-11-15.
- GBIF occurrence records under CC0 and CC BY 4.0. CC0 and CC BY 4.0 per record. Read 2026-11-15.
- ReptTraits v1.2. CC BY 4.0. Read 2026-11-15.
- US Census Bureau cartographic boundary files 2023. Public domain (US Census Bureau). Read 2026-11-15.
- USGS GAP 12-digit hydrologic unit range units. Public domain (USGS). Read 2026-11-15.
- USGS Gap Analysis Project Species Range Maps CONUS_2001. Public domain (USGS). Read 2026-11-15.
- iNaturalist photographs under CC0 and CC BY. CC0 and CC BY per photograph. Read 2026-11-15.
How each figure is derived is set out on the methods page.